Graphic Equalizer
Purpose
The purpose of the Graphic Equalizer Project (referred to in this report as the “GE Project”) was to improve essential CAD (Computer Assisted Design) skills required for creating a high quality final product and to introduce working with audio on the Arduino. One of the mandates for the Medium ISP was for students to integrate CAD into their projects. The GE Project integrates a custom chassis and PCB, each designed using CAD software.
The GE Project allowed for the improvement of three key skills for all projects.
The first skill that was improved is the use of a software called ViaCAD, which was used to create a custom acrylic case for the project and PCB. An understanding of CAD software for design is indispensable for future engineers in the ACES program who need to bring a product to market.
The second skill improved upon was the use of EAGLE for the design of custom circuit boards, which like ViaCAD, is essential for a polished final product. Other projects that have integrated custom PCBs include the Wireless Communication Project and the Fingerprint Enabled Doorlock project.
The third and final skill obtained as a result of the GE Project was the ability to process audio using the Arduino. Processing audio input was not a skill needed for previous projects and it presented an entirely new challenge for the GE Project.
| Parts List |
|---|
| 8 x LED I2C Bargraph Displays |
| MSGEQ7 IC |
| ATmega328P TQFP (Surface Mount) |
| Sparkfun AVR Pocket Programmer |
| 16 Mhz Crystal Oscillator |
| Programming ICSP Header |
| Adafruit Microphone Breakout |
| 5 Pin Female Header |
| 40 Pin Female Header |
| 2 x 100k Ω Resistor |
| 10k Ω Resistor |
| Surface Mount 330 Ω Resistor (1206 Package) |
| Surface Mount LED (1206 Package) |
| 3 x 100 nF Capacitor |
| 3 x 33 pF Capacitor |
| 10 nF Capacitor |
| DC Power Barrel Jack |
| 8 x M3 Screws |
| 2 x M3 Standoffs |
| Custom Acrylic Chassis |
| Custom PCB |
Reference
Procedure
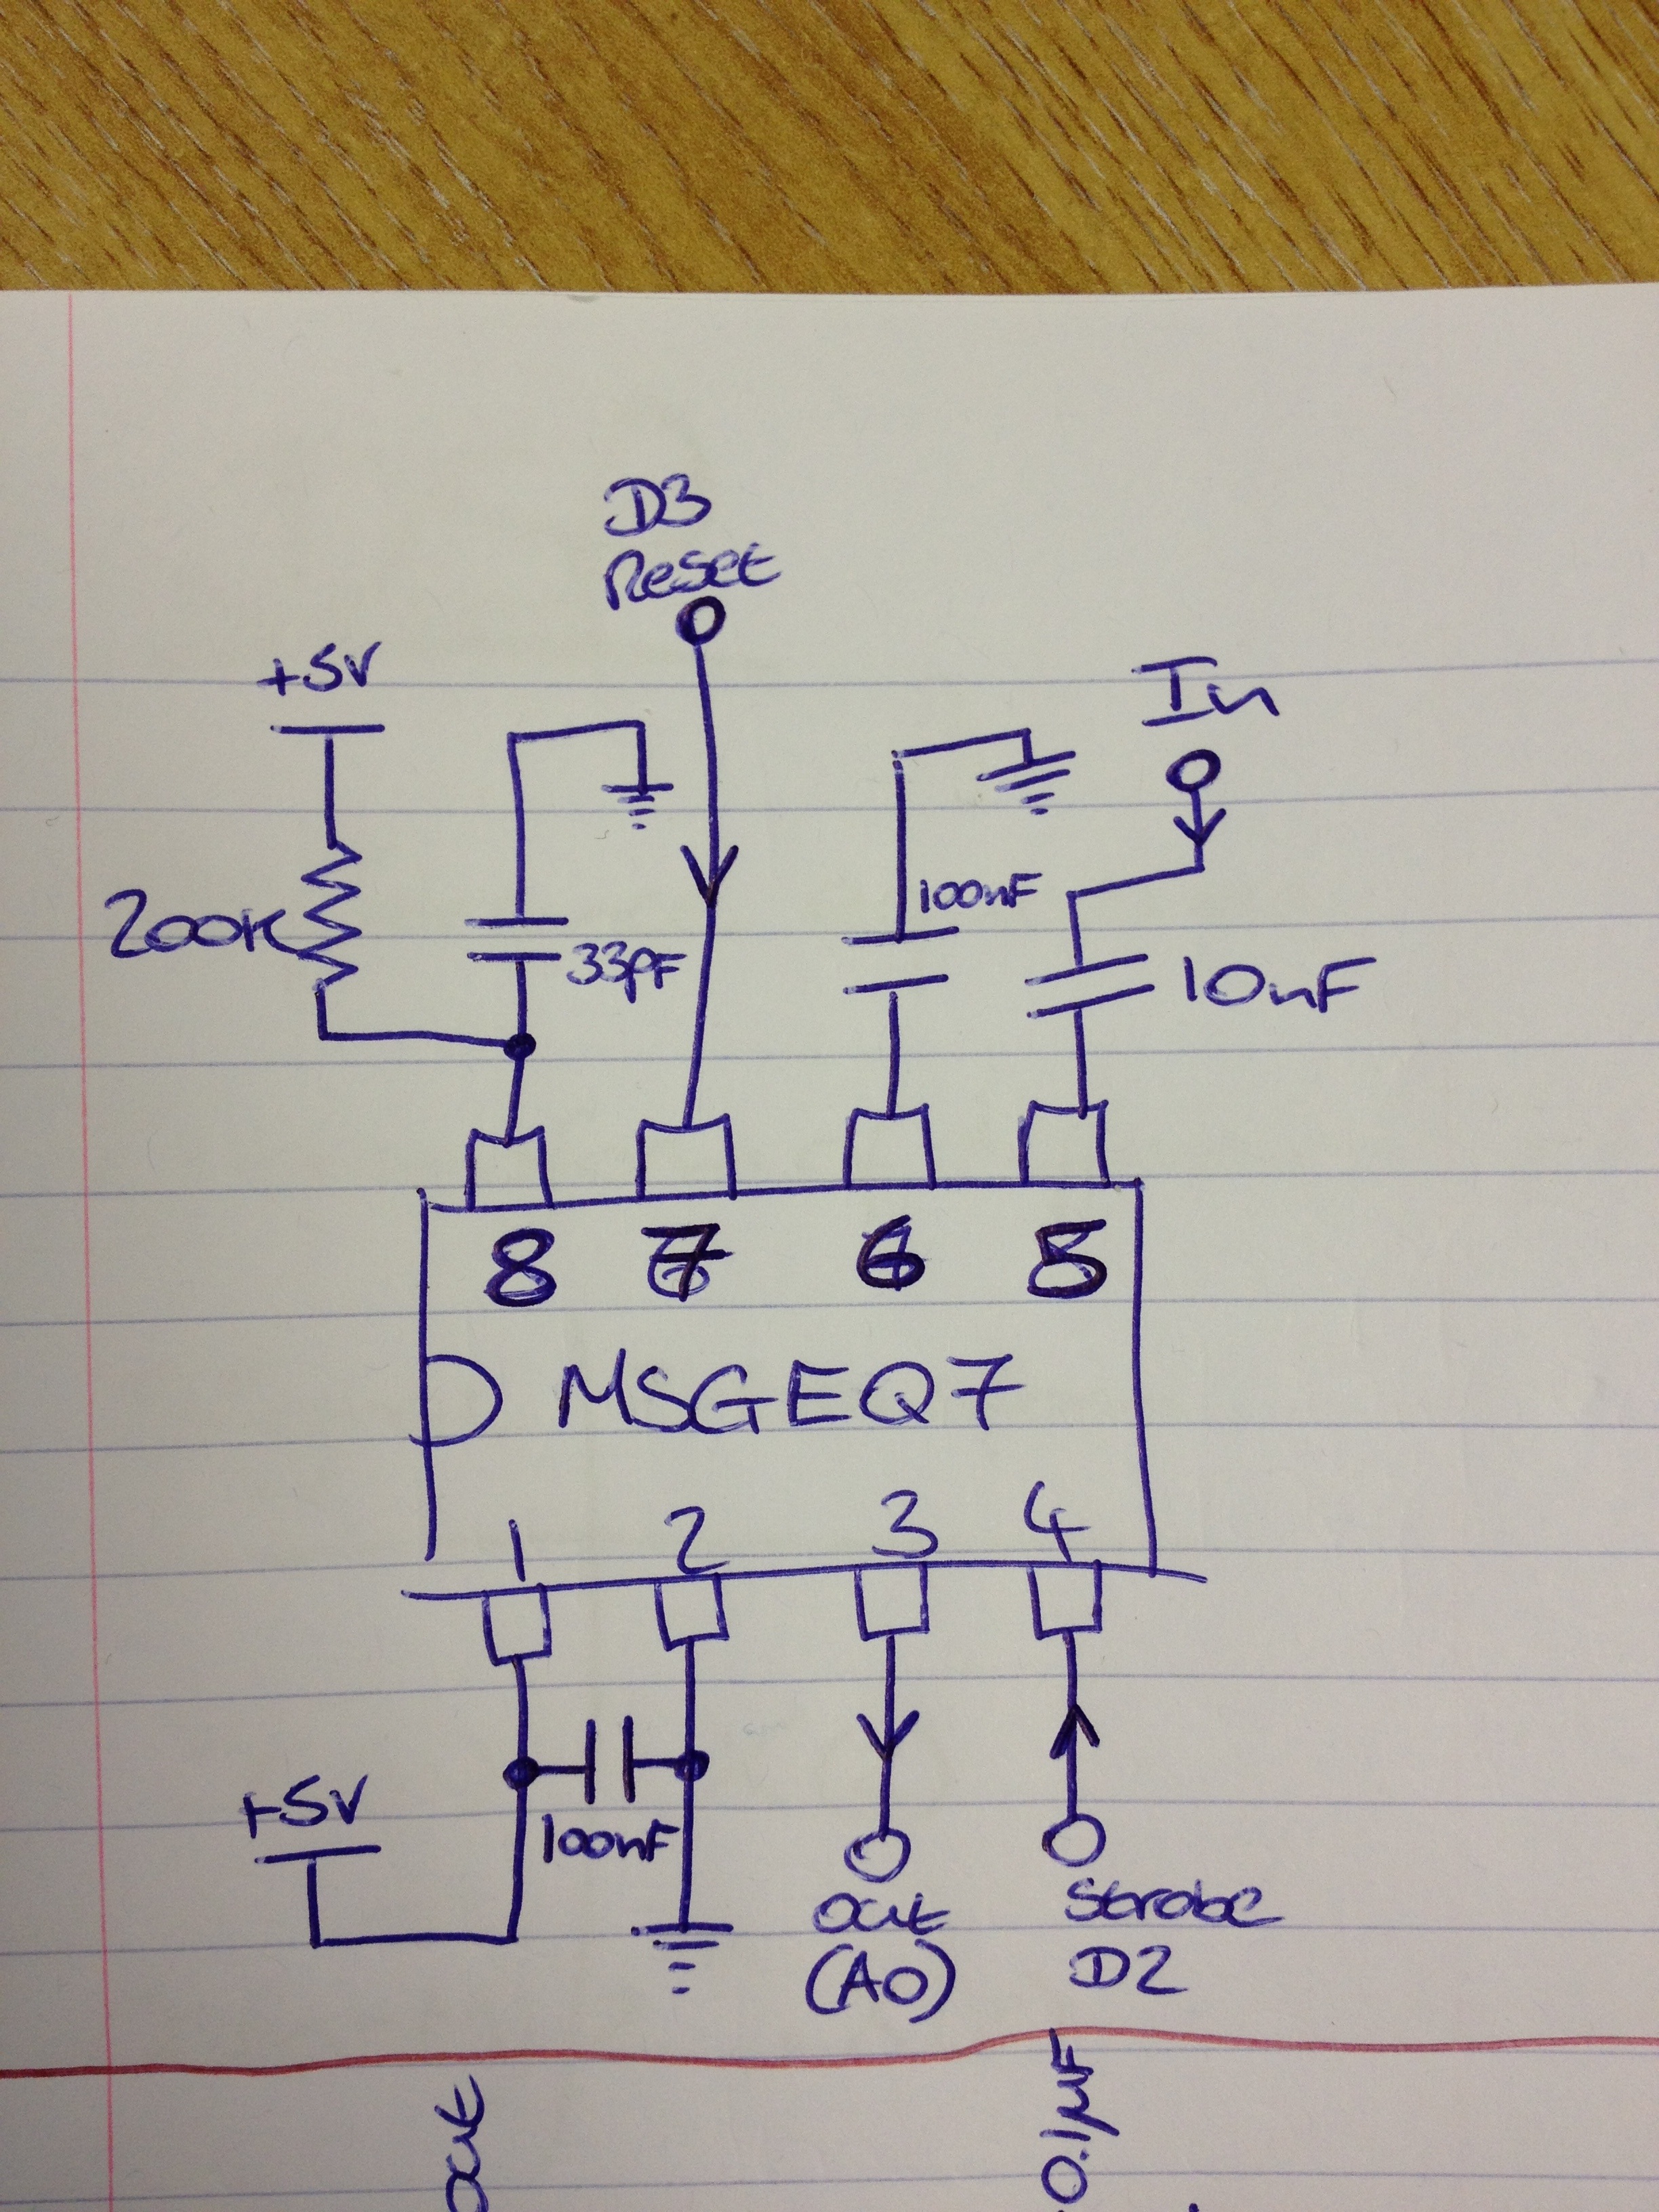
The GE Project consists of mainly an MSGEQ7 Spectrum analyzer chip, eight Adafruit I2C BiColor Bargraphs and a surface mount ATmega328P microcontroller. The microphone is connected to the input pin of the MSGEQ7, which breaks up the audio into unique frequency bands (bass, mids, highs etc.) and sends their values to the ATmega328P. The ATmega328P reads in these values using its ADC (analog to digital converter) so they can be shown on the bar graph displays. The GE Project consists of 3 steps; prototyping, programming and CAD designing.
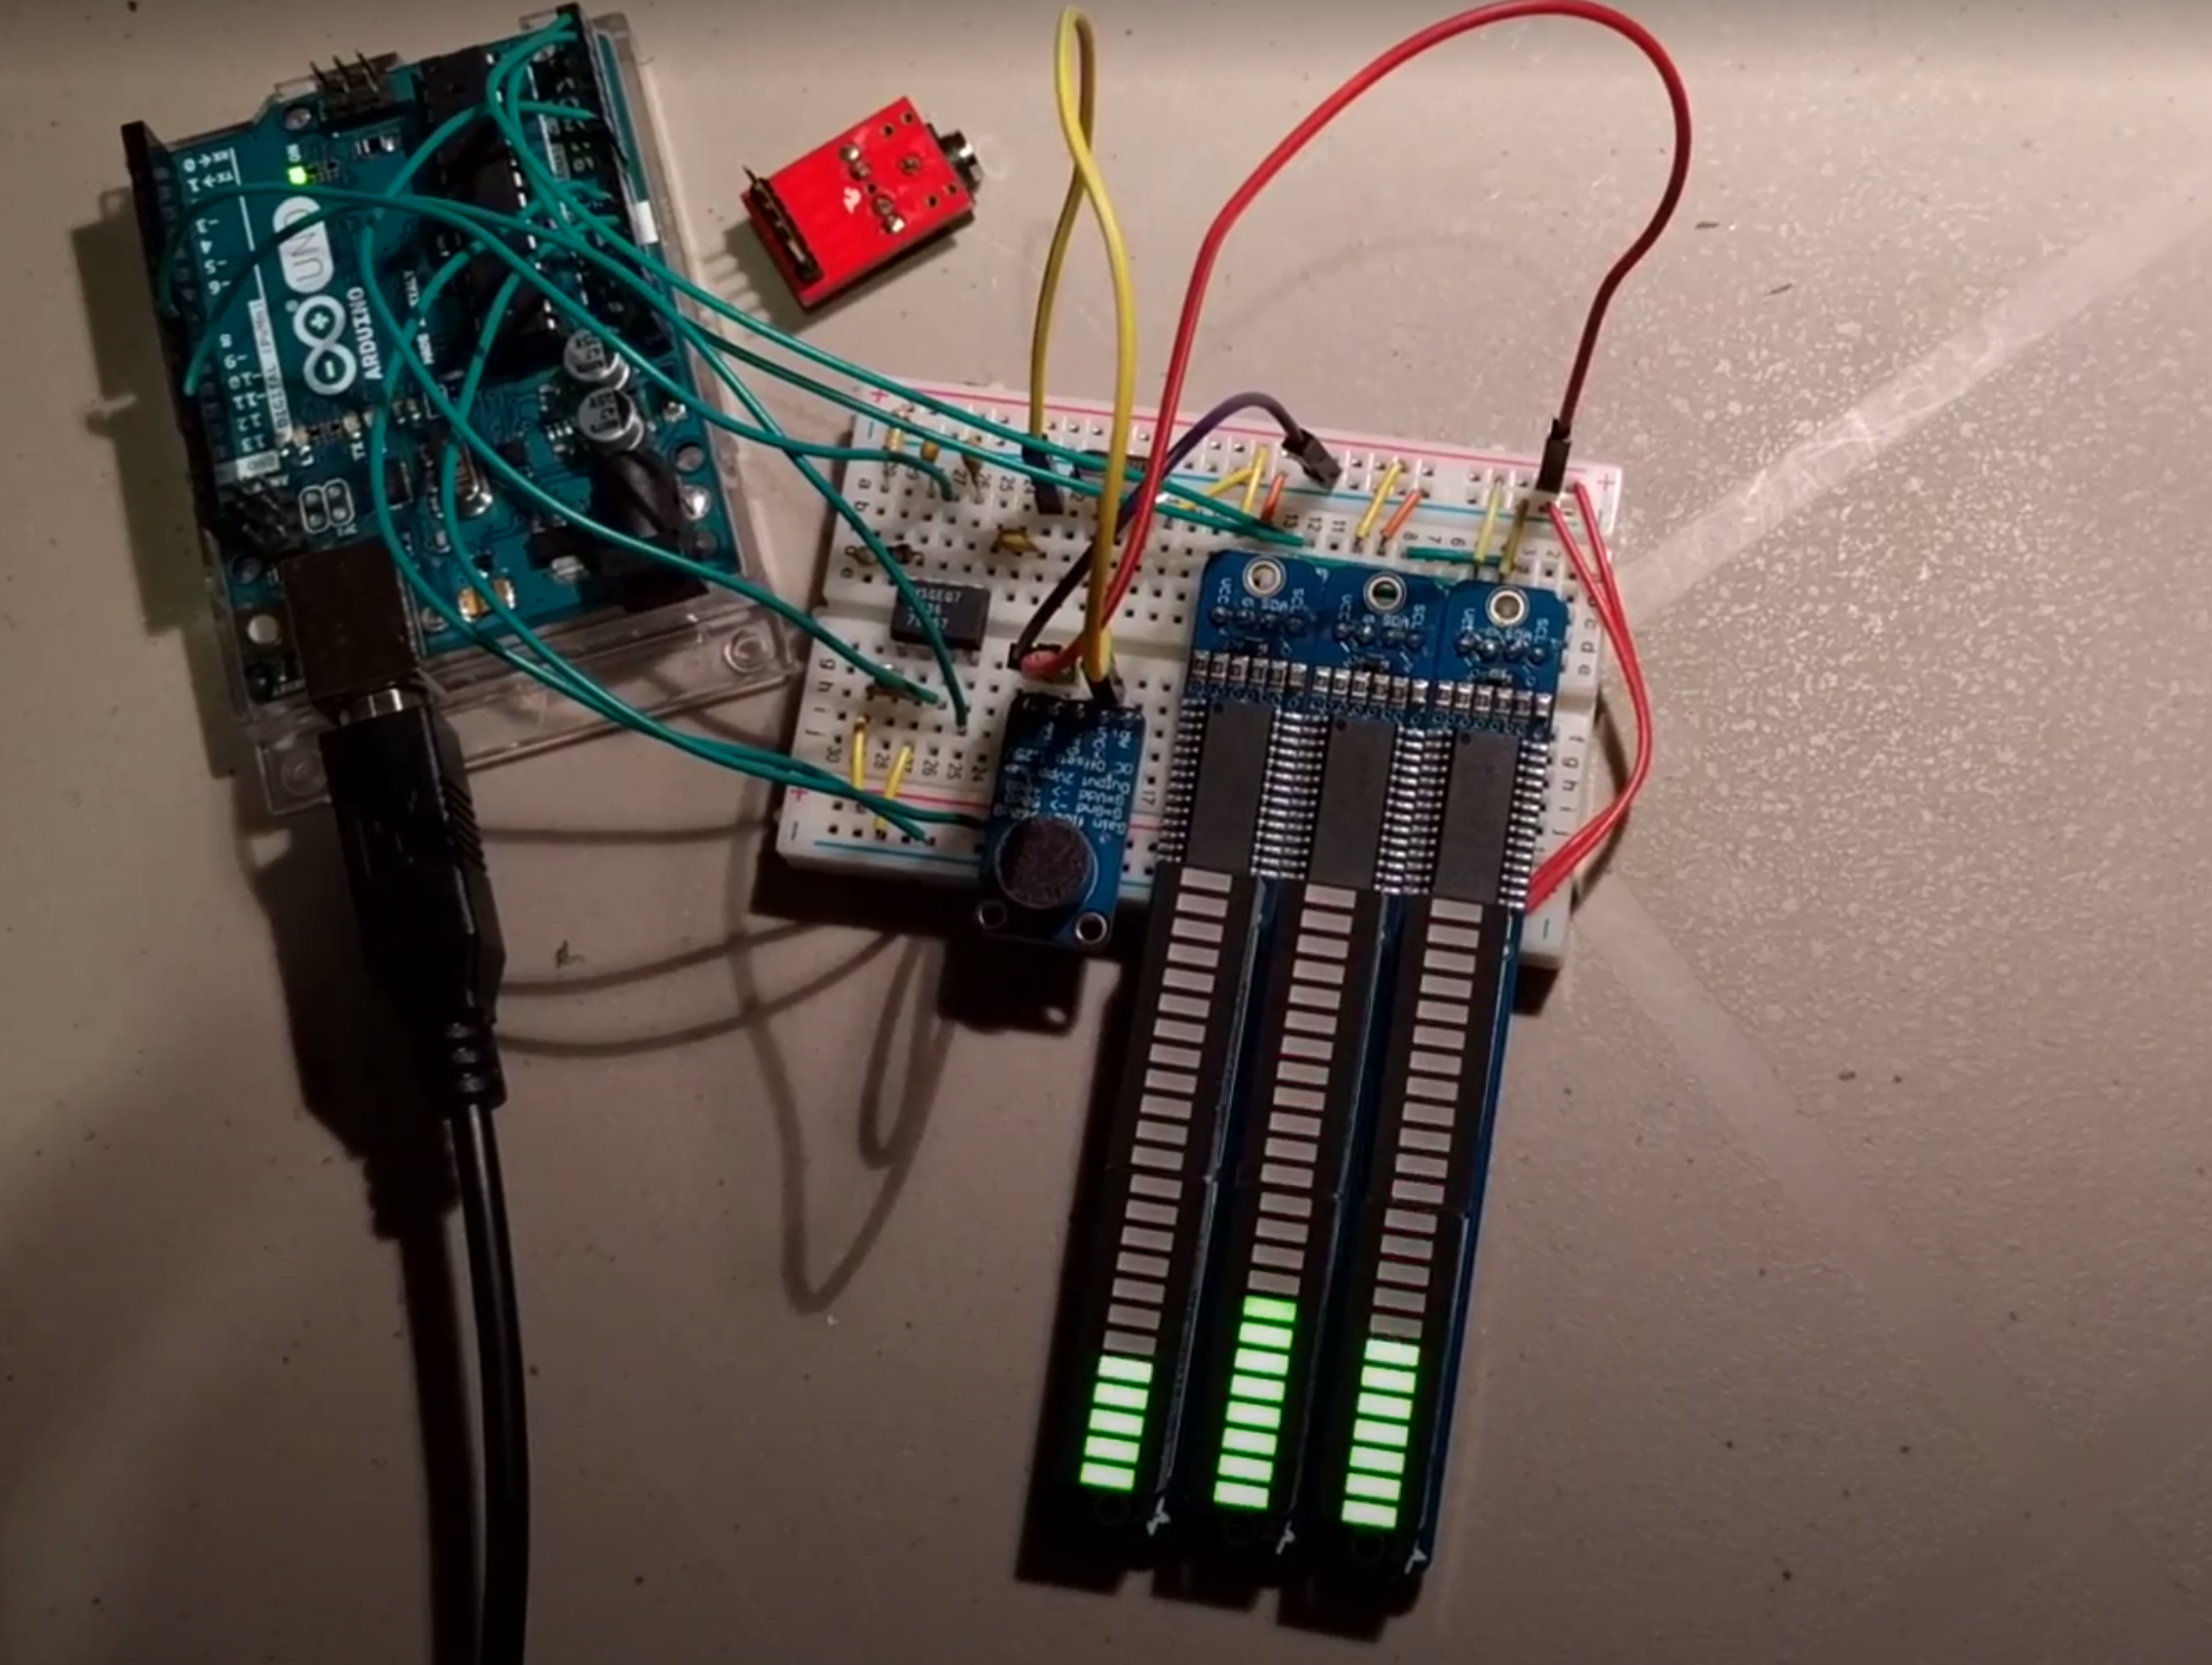
The first step in building the GE Project was to prototype the circuit. The MSGEQ7 was set up with all the special capacitors it required to operate and was subsequently hooked up to one of the analog input pins on the Arduino. A 3.5mm audio jack served as input for the MSGEQ7. The I2C pins of the Arduino were connected to three BiColor LED bar graphs provided by Adafruit. Each bar graph had its address adjustment pins soldered in a manner so that each had unique I2C addresses, thus permitting unique data to be displayed on each one. Although the MSGEQ7 produces data from seven different frequency bands, only three bar graphs were used due to limited breadboard space. Once the undersigned obtained a microphone breakout board, he replaced the 3.5mm audio jack with the microphone to visually represent sound in any room.
The second step was to write the code required to operate the prototype circuit.
The first step in writing the code was to read the values for each of the seven
bands from the MSGEQ7. This was accomplished using a for() loop that iterated
seven times, collecting data from the output pin of the MSGEQ7 and placing the
value into an array. Every time the loop iterated, the strobe pin was brought
HIGH and then LOW ensuring data from a new frequency band was being collected
for each iteration of the loop. Once the spectrum data was collected in an
array, the next step was to display that data on the bar graph displays. To
accomplish this, the required Adafruit library was imported and an array of
seven bar graph objects was created, each initialized with a unique I2C address.
Two new functions were designed to visualize the audio data, one named
showBars() and the other named resetBars(). The showBars() function takes a bar
graph object and number of bars to display as parameters. The function enabled
the requested number of LEDs on the requested bar graph and modified the color
of the LED depending on how high the resulting bar reached. For instance, if an
LED was in the mid section of the bar graph, it would turn on with a yellow
color and when the LED was in the upper section of the bar graph, it would be a
red color when enabled. The showBars() function is displayed in the photo above.
The resetBars() simply uses a for() loop to turn off all the LEDs, so that when
the showBars() function is called no unwanted LEDs are left on. Once the
resetBars() and showBars() functions were complete, it was time to implement the
audio data visualization. First, a new variable called barNum was created within
the for() loop that collected the audio data. The variable was set to the value
current band in the audio spectrum over which the for() loop was iterating. The
only issue was that the value ranged from a value 0-1023 while it needed to be a
value of 0-23 to work with the showBars() function and bar graph. The map()
function was used to map the 0-1023 spectrum value to a suitable range for the
bar graph. Once the barNum variable was initialized with a value in the proper
range, the showBars() function was called with barNum as the argument for the
number of bars and the current bar graph object being iterated over in the array
by the for() loop. Eventually, the code was revised to link the array storing
the bar graph objects and the array storing spectrum data more closely using a
struct.

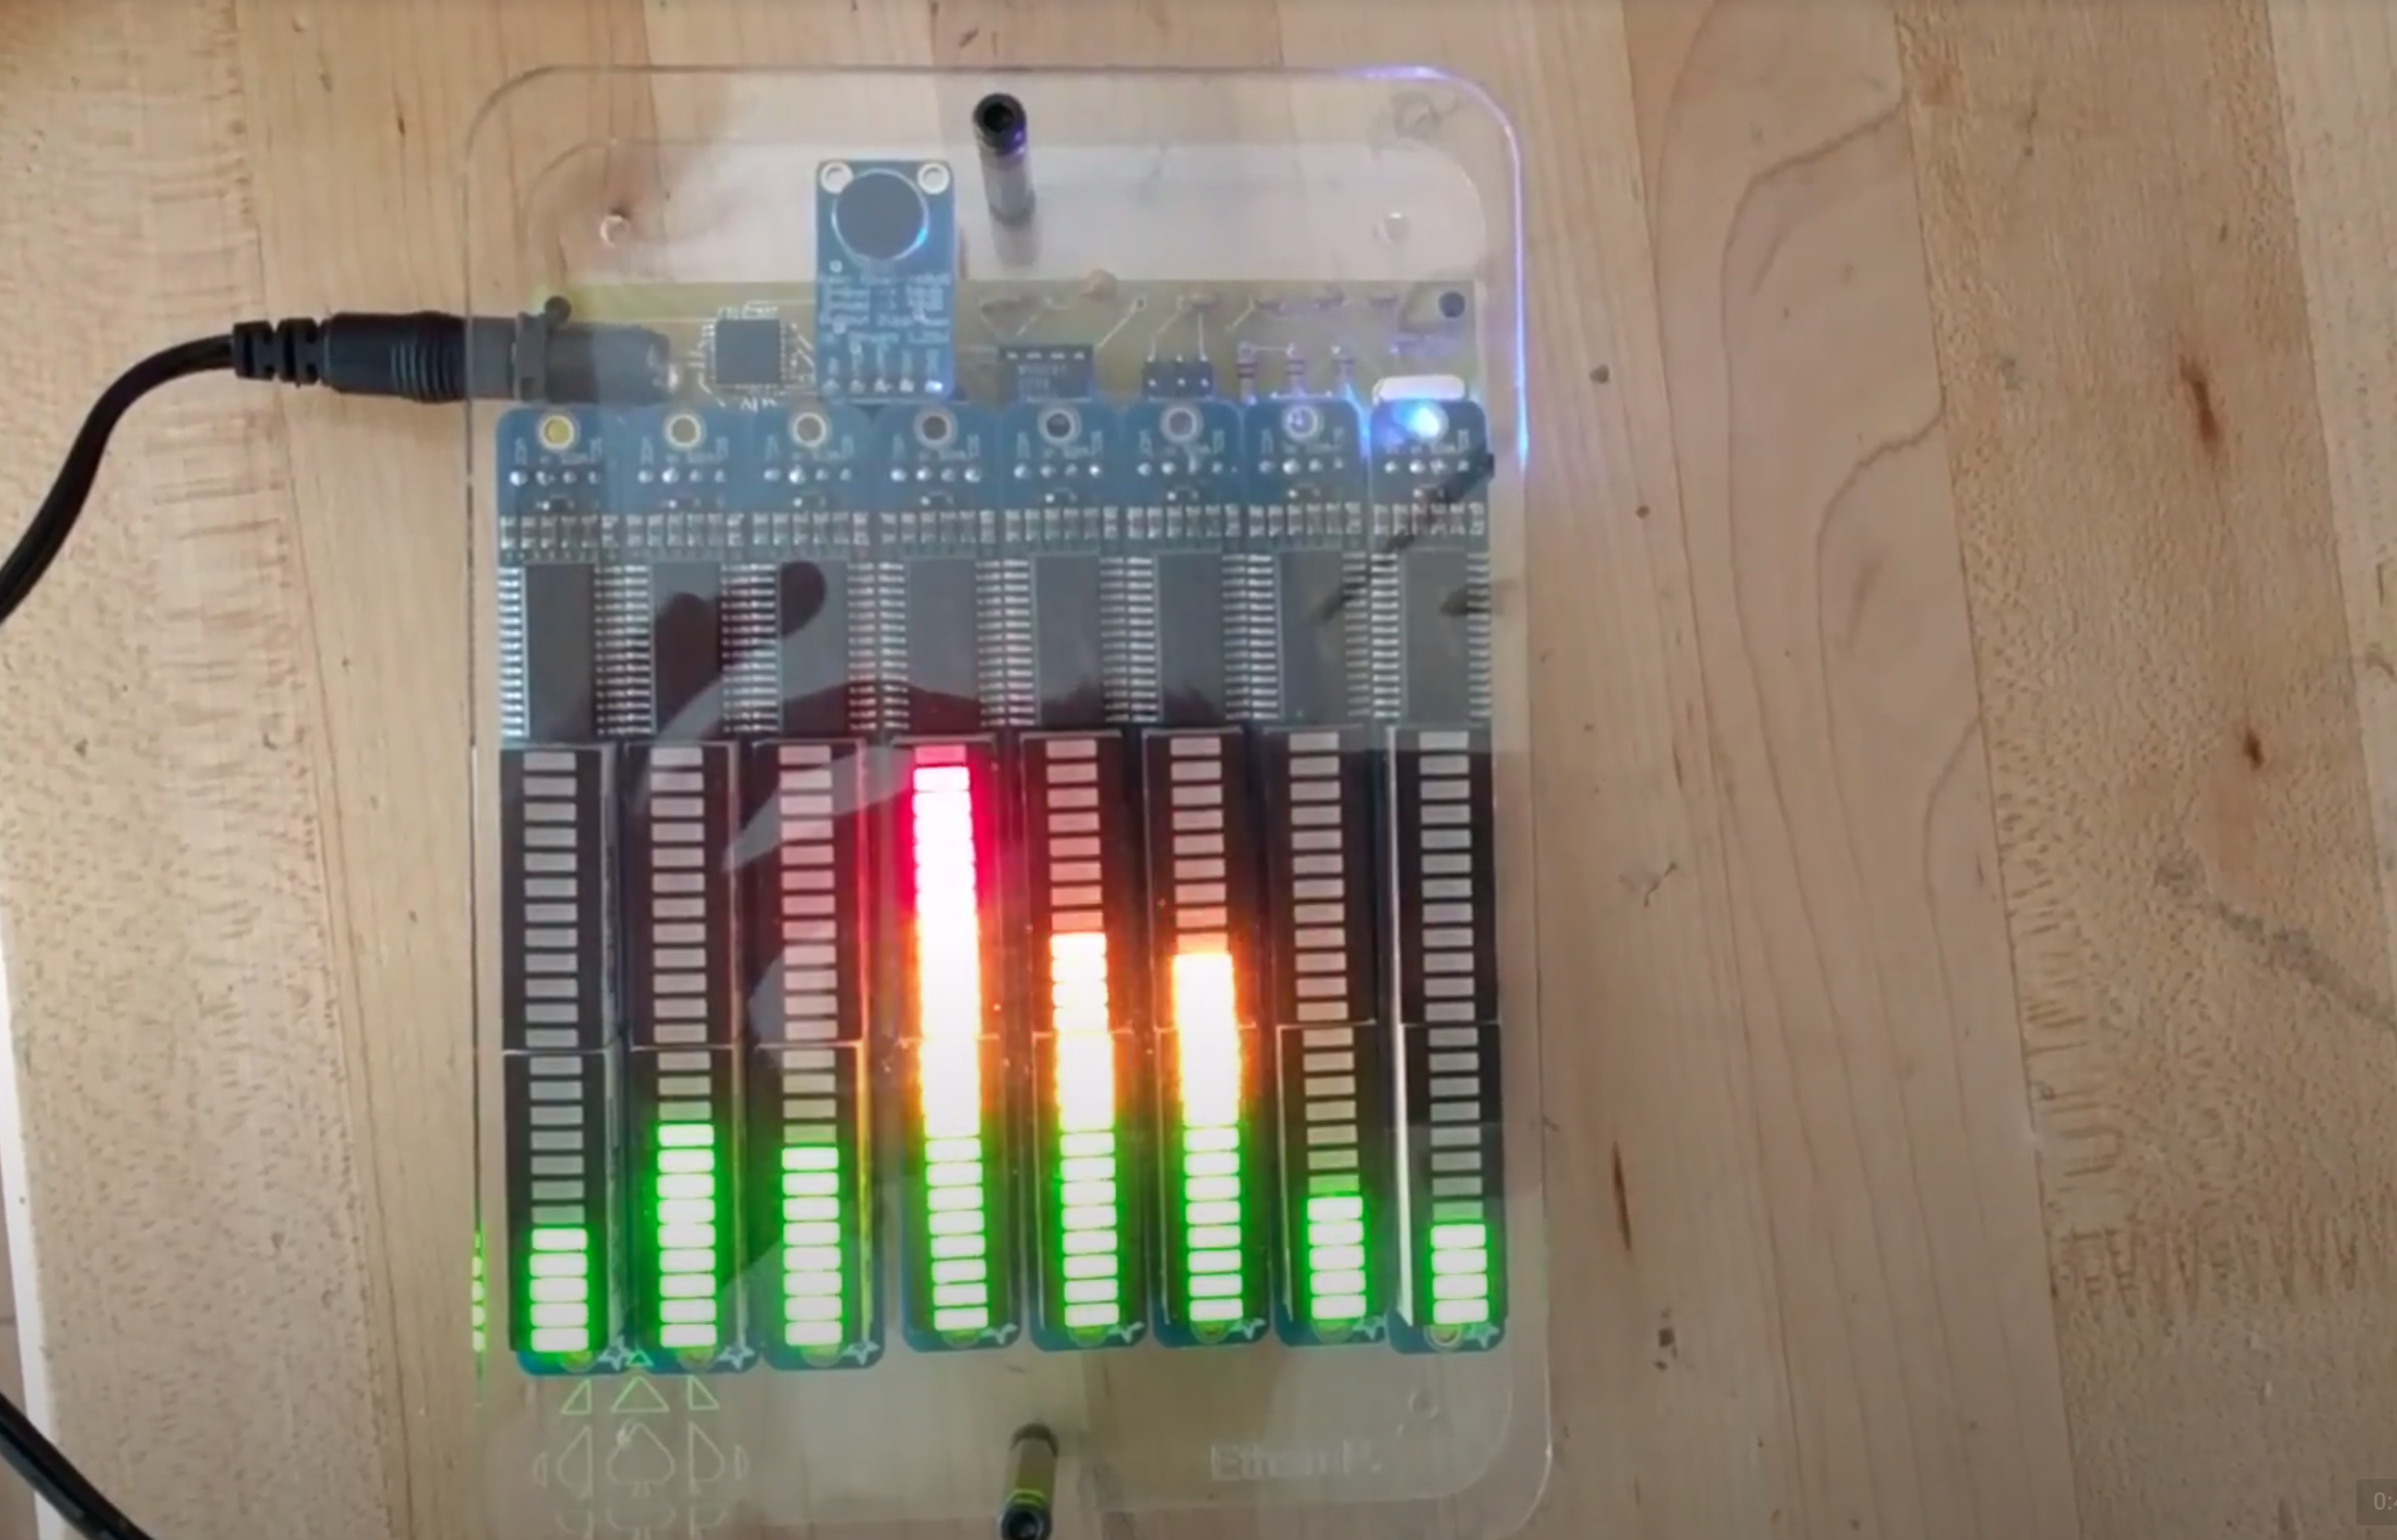
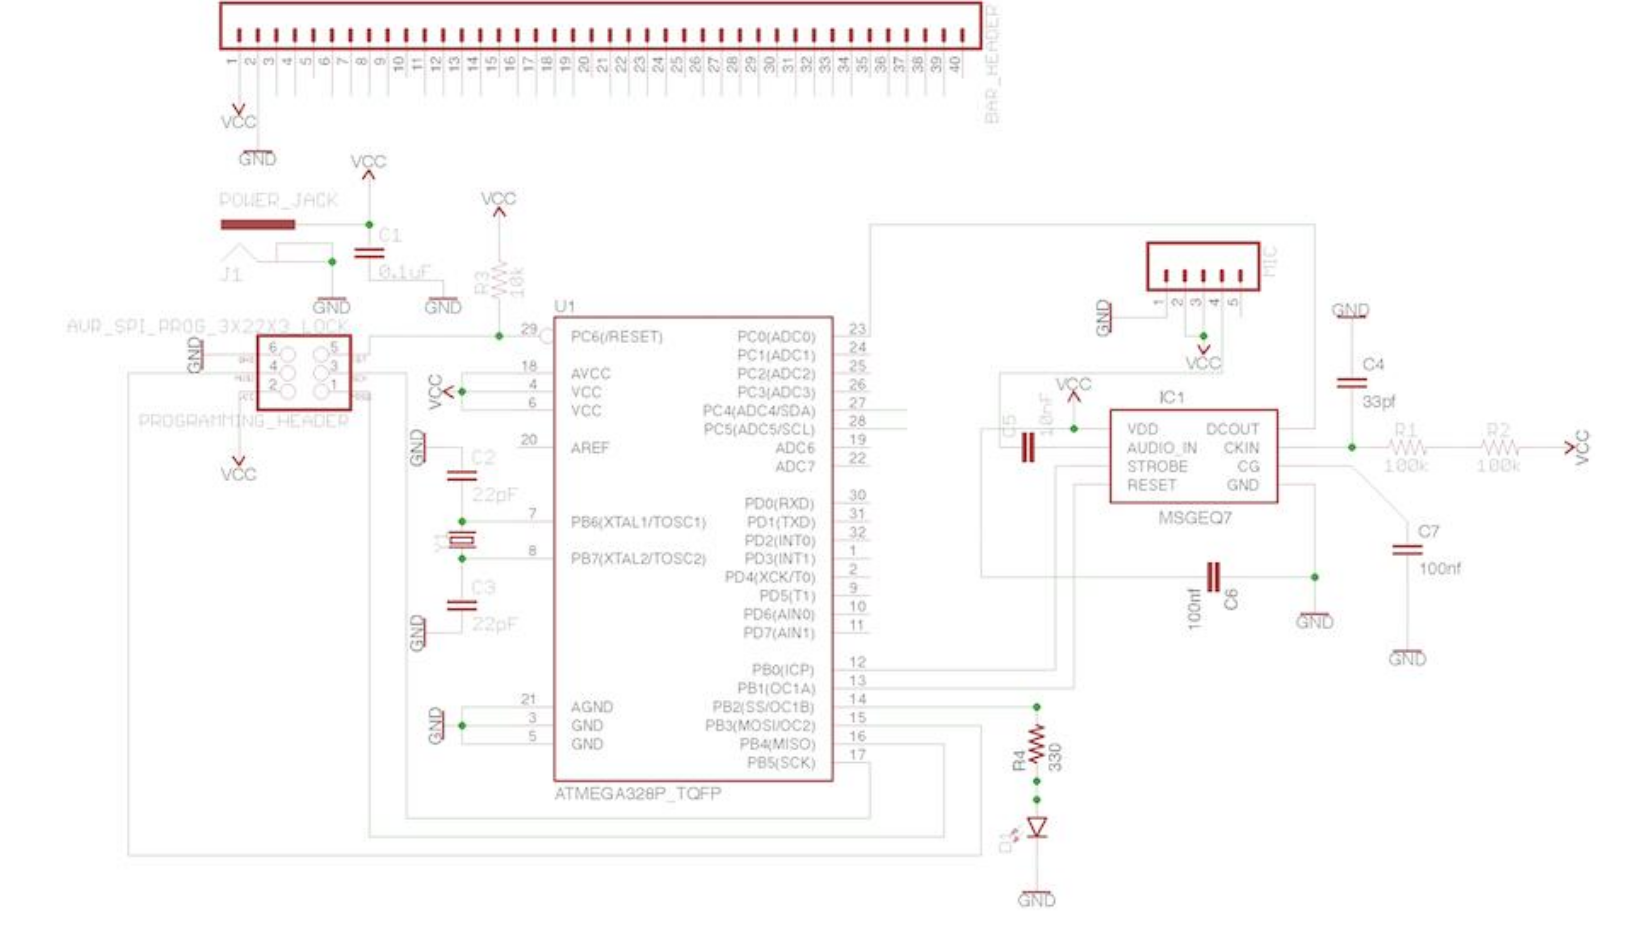
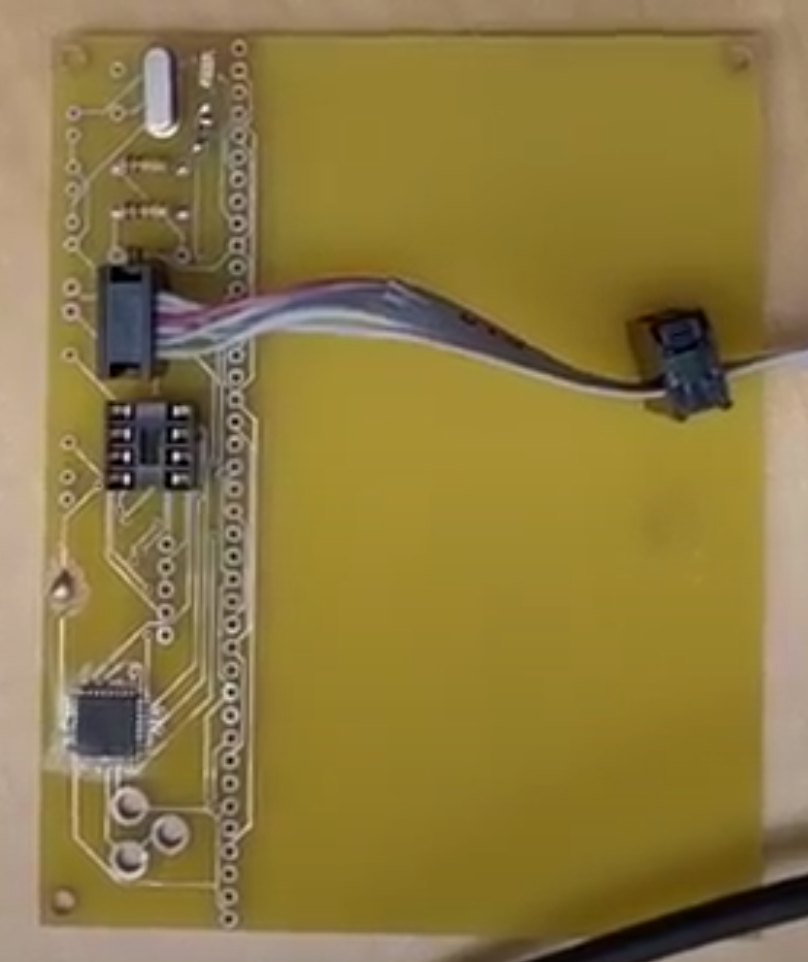
The final step in building the GE Project was designing the custom PCB, custom chassis and assembling the final product. The acrylic chassis for the GE Project was designed using a CAD software called ViaCAD. The chassis consists of two clear acrylic plates. The front plate has two screw holes used to connect it to the back plate using standoffs and an engraving of the ACES logo in the bottom left corner. The back plate is made up of screw holes for the custom PCB and mounting holes for the mounting of the final product on a wall. Once the final design of the acrylic chassis was complete, the dimensions of the board that would fit the chassis were imported into EAGLE. The circuit that was laid out on the custom PCB differed from the breadboard prototype in a few key ways. The first difference was that no Arduino was involved with the PCB. Instead, a surface mount ATmega328P was used, along with a 16Mhz crystal where a 2x3 male pin header is used for programming.
The second difference is that the PCB makes use of eight I2C bar graphs instead of three. The third key difference is that a surface mount resistor and LED are connected to the ATmega328 for testing purposes. However, the final PCB was not perfect upon testing and assembly. The key issue with the board was that there was not enough clearance between the pin headers for the bar graphs and the pin header for the microphone, causing the two components to be pushed closely together by force. The second issue with the board was that there were too many pin headers for the bar graphs. There were enough pin headers for eight bar graphs whereas pin headers for only seven bar graphs were required. The issue was circumvented by adding an additional bar graph display in the last space in the pin header that shared the same address as the first bar graph, thus allowing the eighth bar graph to mirror the data of the first. The soldering of the custom PCB was relatively straightforward since most of the board requires through hole components. However, the process was made difficult when it came to soldering the surface mount components to the PCB. At this point, fellow ACES student Puneet Bagga was able to provide instruction to the undersigned on using a stencil for the ATmega328P TQFP chip, properly applying the solder paste and soldering the chip using the hot air rework station. The surface mount resistor and LED presented an even larger challenge to solder as no stencil was available for these components and they had to be soldered by hand using the hot air rework station.
Media
Code
// Import Adafruit Libraries
#include <Adafruit_GFX.h>
#include <Adafruit_LEDBackpack.h>
#include <gfxfont.h>

struct dataPair { // pairs set of spectrum data with a bargraph object
  int spectrum;
  Adafruit_24bargraph bargraph;
};

int audioIn = A0; // analog input pin hooked up to the MSGEQ7
int strobe = 8;   // pin connected to strobe pin on the MSGEQ7
int reset = 9;    // reset pin of the MSGEQ7
int filter = 80;  // minium audio level to filter out noise

// array storing spectrum value and related bar graph object
dataPair dataPairs[7];

void resetBars(Adafruit_24bargraph bar) {
  for (uint8_t i = 0; i < 24; i++) {
    bar.setBar(i, LED_OFF);
  }
} // clears bargraph display without writing changes

// shows specifed # of bars on the bargraph
void showBars(uint8_t barNum, Adafruit_24bargraph bar) {
  resetBars(bar); // reset bars first so only the intended ones are showing
  for (int j = 0; j < barNum; j++) {
    if (j <= 8) {
      bar.setBar(j, LED_GREEN);
    } else if (j > 8 && j <= 16) {
      bar.setBar(j, LED_YELLOW);
    } else {
      bar.setBar(j, LED_RED);
    }
  }
  bar.writeDisplay(); // write changes once all the bars are set
}

void setup() {
  // set SDA and SCL pins as output
  pinMode(A4, OUTPUT);
  pinMode(A5, OUTPUT);
  // initialize each bargraph object in the array with unique I2C address using
  // a for loop

  uint8_t address = 0x70;
  for (int i = 0; i < 7; i++) {
    dataPairs[i].bargraph.begin(address);
    address += 0x01;
  }

  // set strobe and reset pins to output and ensure AREF is set to default since
  // we will be using the ADC
  pinMode(strobe, OUTPUT);
  pinMode(reset, OUTPUT);
  analogReference(DEFAULT);

  // reset the MSGEQ7
  digitalWrite(reset, HIGH);
  digitalWrite(reset, LOW);
}

void loop() {
  // collect and display audio data from the MSGEQ7
  for (int i = 0; i < 7; i++) {
    // pulse strobe pin
    digitalWrite(strobe, HIGH);
    digitalWrite(strobe, LOW);
    delayMicroseconds(22); // let output settle
    // read from the MSGEQ7 and constrain the reading according to the filter
    dataPairs[i].spectrum = constrain(analogRead(audioIn), filter, 1023);
    delayMicroseconds(3); // allow analog reading to settle
    // get number of bars to show and display them
    int barNum = map(dataPairs[i].spectrum, 0, 1024, 0, 24);
    showBars(barNum, dataPairs[i].bargraph);
  }
}
Conclusion
Overall, the GE Project allowed for improvement in CAD design skills and introduced the new concept of integrating audio into Arduino projects. This project was also unique in integrating a complete custom chassis and PCB, thus allowing for a higher quality finished product.